Find your area
Search for a neighborhood to find the police district that serves it. Records remain aggregated by district (CISP), not by street or neighborhood.
Lab · Public data · 2026
I built the Rio Crime Map to make Rio de Janeiro’s police records easier to explore and compare, with time periods, population, and data limitations visible alongside the numbers.
App available in Portuguese · MIT-licensed open-source code
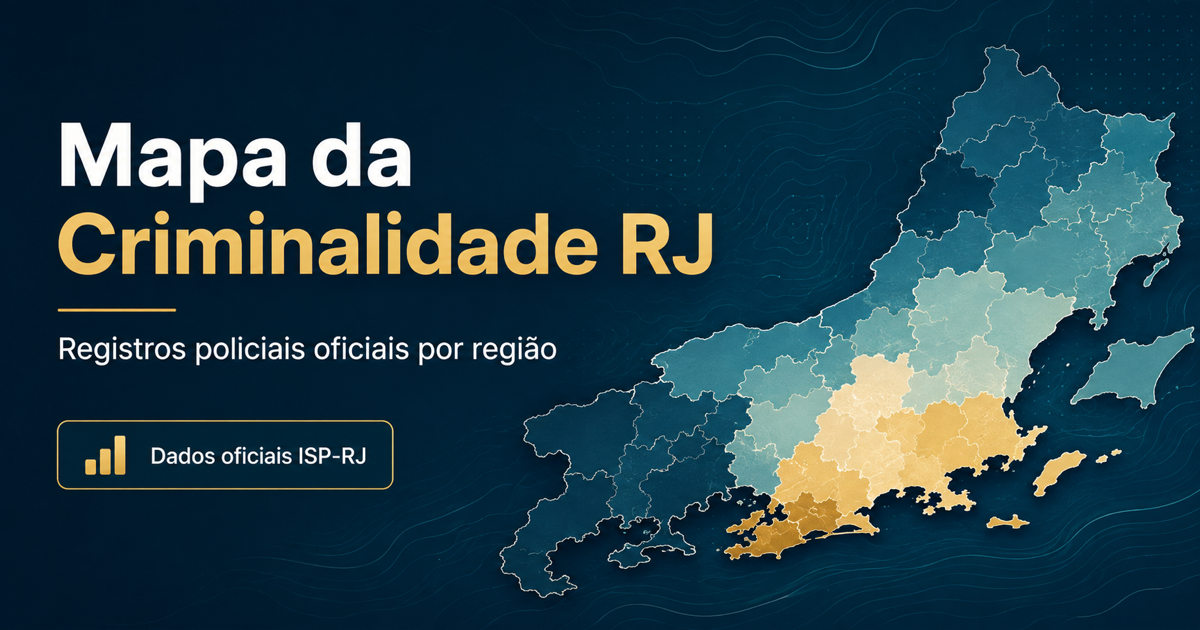
How have police records changed in my area? What changes when we account for population? The aim is to let anyone explore these questions without having to build their own data analysis.
Search for a neighborhood to find the police district that serves it. Records remain aggregated by district (CISP), not by street or neighborhood.
Switch between counts and rates per 100,000 residents. Compare equivalent periods and inspect the population used in the calculation.
Explore incident types, rankings, and insights computed from the loaded data. Every comparison identifies its time period.
Police records do not capture every crime that occurred. A rate per resident is not the probability of becoming a victim, and it does not account for visitors or commuters. The map does not recommend safe routes.
The ISP-RJ series is monthly and subject to revisions. The app queries the source and computes insights automatically, falling back to a saved snapshot if needed. Population is derived from Brazil’s 2022 Census: it is not updated monthly, and boundary changes require review.
The code is available to study, adapt, and contribute to. Accessibility, visualization, and data-validation improvements are welcome. The MIT license covers the code; datasets and basemaps have their own terms.